
-
Informative data and media for Salish Sea
-
Shoreline homeowners, property managers, parcel owners, civil engineers, geotechnical professionals, realtors
-
-
3D geospatial modeling and mapping of shoreline bluffs and beaches
-
Media and data for landowner projects
-
Advanced and repeatable cinematography
Beaches: Where will storm surge water go?
We deliver high-accuracy, detailed topographic maps of beach shorelines
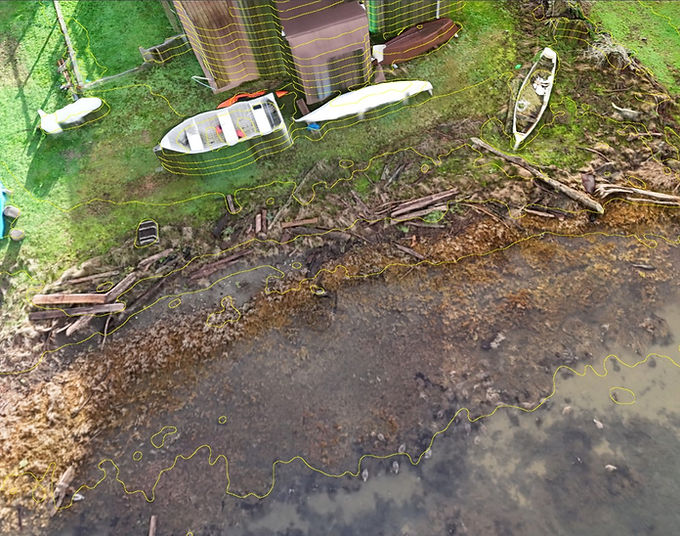
Residents and other owners of properties near saltwater beaches are becoming concerned about damage and loss of emergency access when seawater is surging during winter storms when the tide and barometric pressure is low. Surging water, often carrying logs and debris, can pass through or over the lowest areas along the shoreline to flood lower land areas, buildings and roads. The height of natural berms or hard armoring can provide some protection, however surging water will find the lowest pathways to intrude, flowing inward in various directions at varying speeds. Historic topographic maps, GIS layers and traditional land surveys do not provide recent, detailed height (elevation) data across the tops of existing shoreline barriers to pressures from storm surge.
We can produce a 3D model of portions or all of a community’s shoreline, including access roads and other features. We now operate an industry-leading drone system, the DJI Matrice 4 Enterprise, followed by processing with industry-leading PPK, photogrammetry and terrain analysis software. From the model, we produce a measurable orthomosaic “map” that includes very detailed, topographic contours at 1-foot intervals. For more details, a profile line can be drawn between two higher points next to a lower area. Once drawn, you automatically have a chart of height data along the line. Overall, you would have high-accuracy data to precisely know the lowest areas. Low-cost software is available for studying the orthomosaic, drawing the profile lines, and exporting your own snapshot views to share with neighbors or Island County departments. As a bonus, the orthomosaic can be analyzed to calculate the amount of cut or fill material that would be needed to have a shoreline that presents a level obstacle to storm surge.
Below, the upper image shows elevation contours near a shoreline at 1 foot intervals (in yellow). The lower image shows an elevation profile line (in red), with a chart showing elevation data at points along the line. Note that a neighboring property has a higher shoreline.
Visit the Contact page to reach out with a parcel number(s) where there is concern about lower areas along the shoreline where seawater may surge through. We can then develop a quote for the appropriate level of service.